- Entry
- 003
- Source scale
- Zone width
- Method
- Projection specification and sheet margin
- Section
- Projections
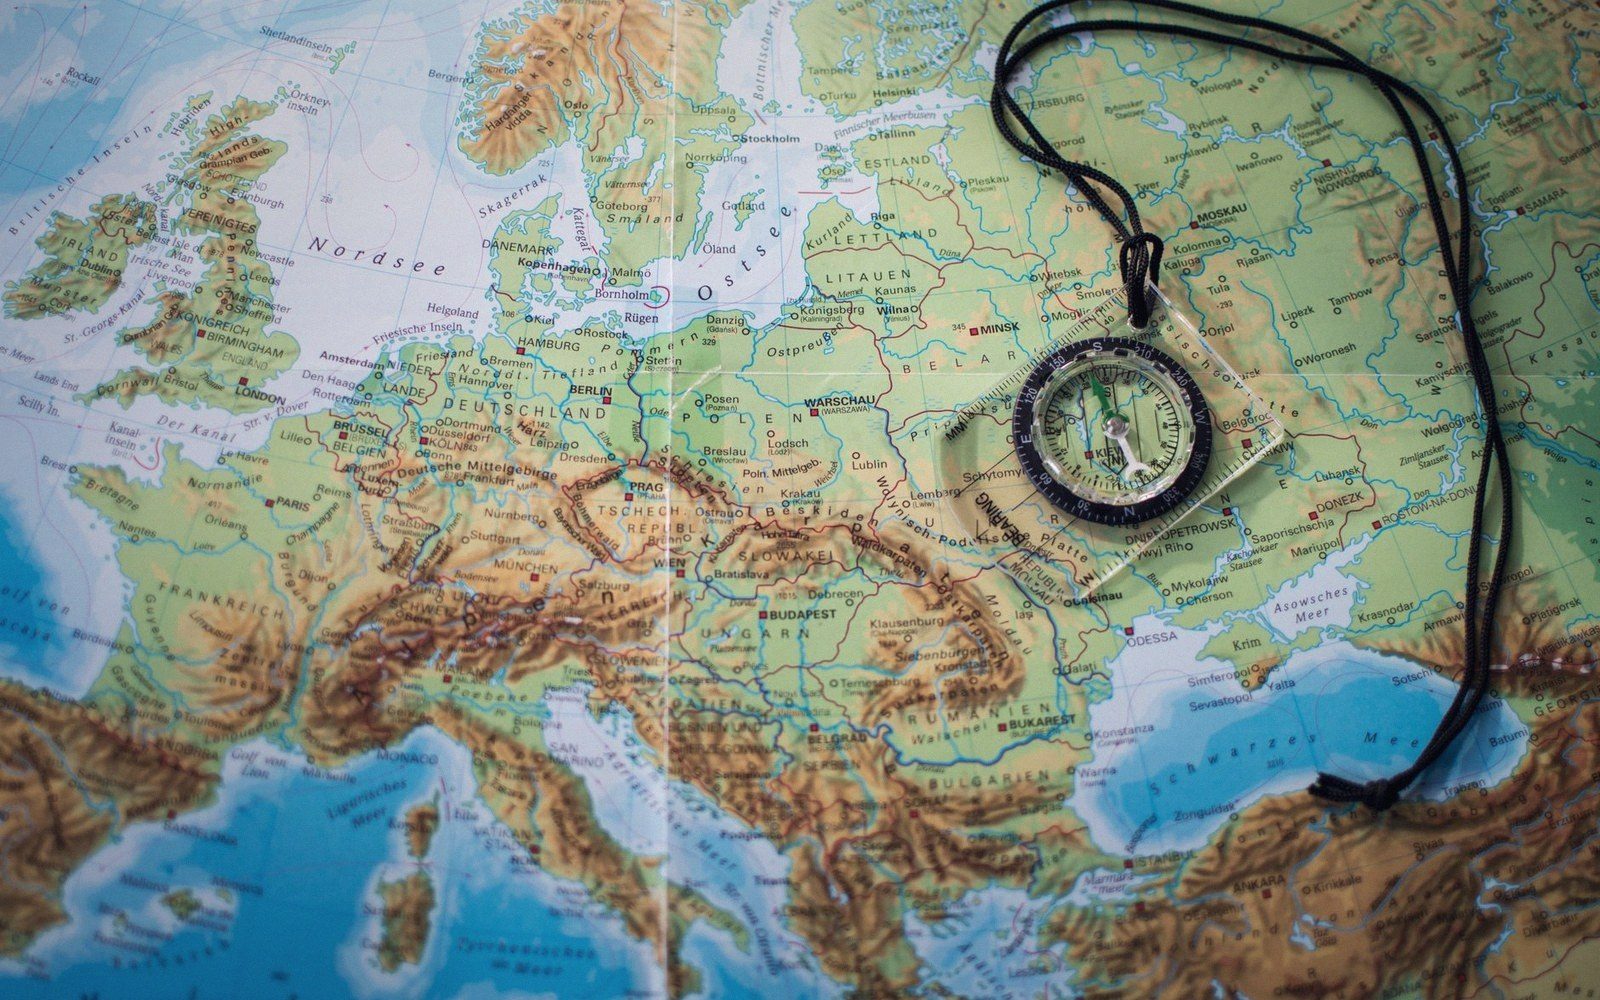
On a small-scale sheet the trade between shape and area is unavoidable, and the reader is rarely told which was kept.
Photo: Aliaksei Lepik / PexelsThe Fundamental Constraint
Spread a sphere onto a flat surface without tearing it and something must give. Gauss proved this formally in the nineteenth century: no map of a curved surface can be both conformal and equal-area at once. Conformal projections, those that preserve angles locally, keep shapes true at every point but distort area as you move away from the standard line. Equal-area projections do the opposite — every region occupies exactly its proportionate share of the sheet, but shapes are squeezed and sheared to make the accounting balance.
The mechanism is straightforward. On any projection, the scale factor varies — it differs along and across the direction of travel. A conformal projection keeps those two factors equal at every point, which is why circles stay circles locally. An equal-area projection keeps their product constant instead. The two scale factors compensate for each other, which means that wherever one stretches, the other contracts. High latitudes under the Albers equal-area conic, for instance, are compressed north–south just enough to counteract their east–west stretching. The areas come out right; the shapes do not.

A sphere cannot be flattened without tearing or stretching it. Every projection decides which property survives the transfer.
Why Navigators Distrust Them
This is why equal-area projections are unpopular with anyone navigating. A compass bearing on a conformal chart transfers cleanly to the ground — angles are what they appear. On an equal-area sheet, angles are locally wrong. The distortion is not uniform and it does not announce itself; a measured bearing on an Eckert or a Mollweide is simply incorrect, by an amount that varies across the sheet and must be computed rather than read. For route-finding, that is intolerable.
The Lambert azimuthal equal-area projection is something of a compromise candidate: it holds area accurately and keeps shape distortion moderate near the centre, which is why it appears in continental and hemispherical reference maps. But it does not solve the problem — it only postpones it toward the edges.

Compilation is desk work. What a field party recorded is turned into lines by someone who was not there.
Photo: Ron Lach / PexelsWhere equal-area projections earn their keep is in thematic mapping. Choropleth maps — shading regions by a rate or quantity — mislead badly on conformal projections, because large-area regions appear even larger and dominate the eye regardless of their value. Comparing deforestation across continents, or plotting species range against land cover, demands equal area as a baseline condition. The data would otherwise lie in plain sight.
The underlying tension is irresolvable. Cartographers choose projections the way engineers choose tolerances: decide what failure mode you can live with, and design around it. For field use, distorted angles are the failure you cannot accept. For statistical display, distorted area is. Neither projection type is wrong; both are honest about exactly what they have given up.
- Conformalangles preserved locally; area grows toward the margins
- Equal-areaevery region holds its correct proportional extent; angles are locally incorrect
- Neither propertyprojections such as the Winkel Tripel split the difference, optimising neither but keeping both distortions moderate