- Entry
- 019
- Source scale
- Block to tract
- Method
- Statistical geography, published units
- Section
- Boundaries
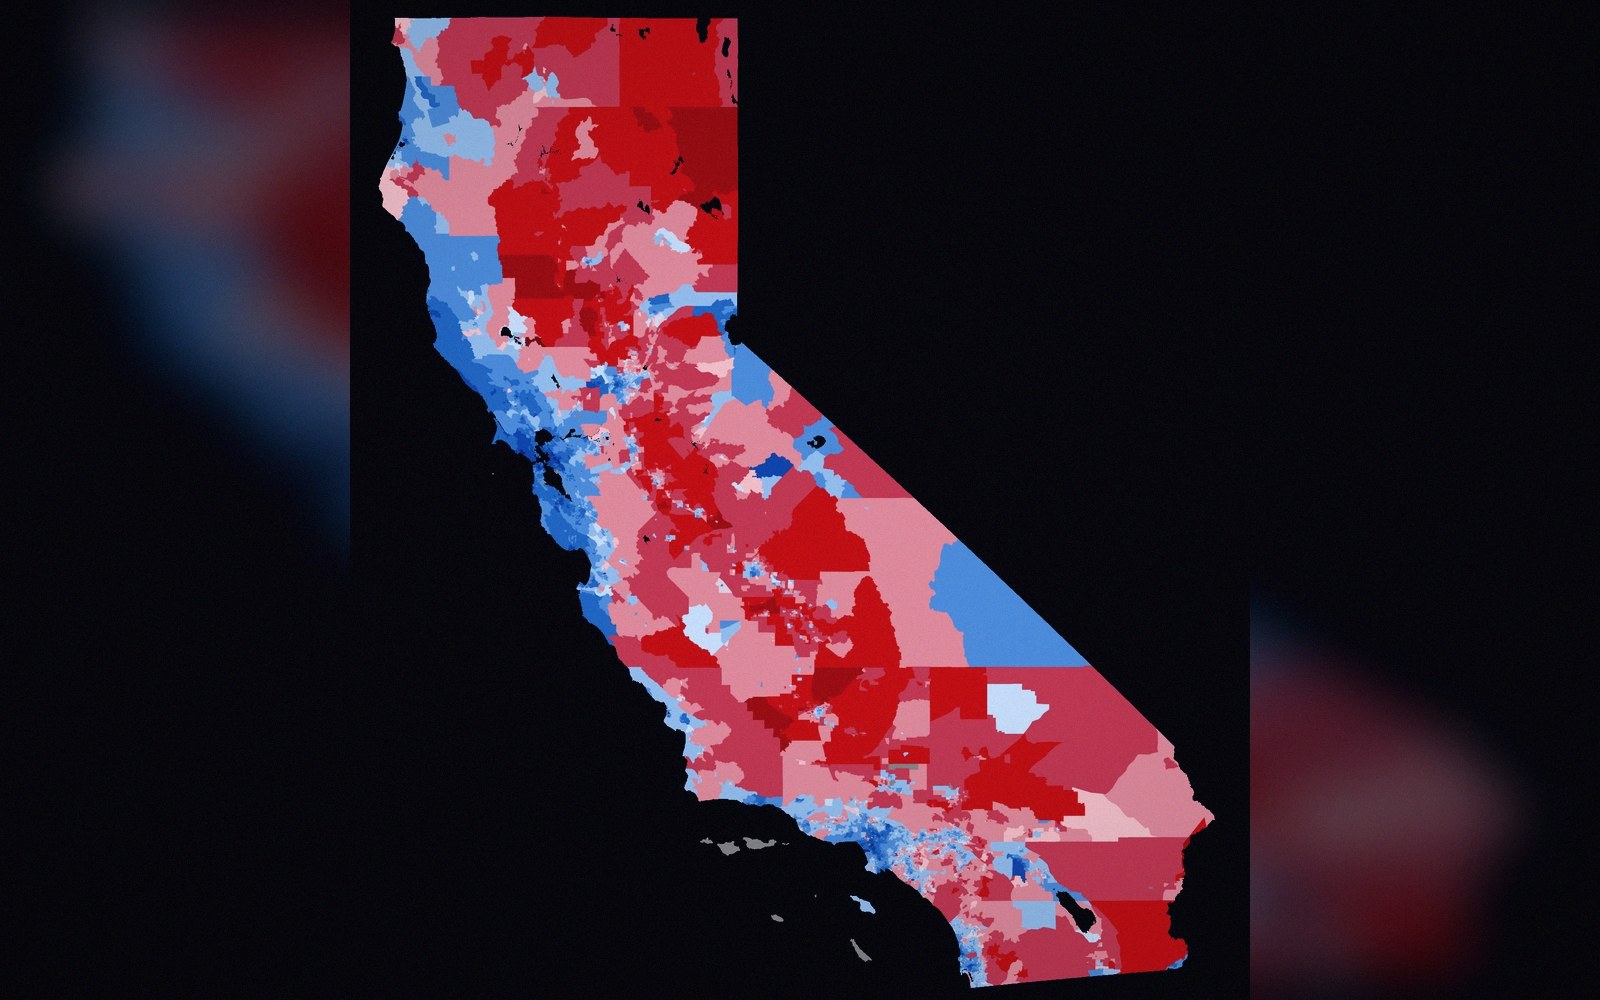
At block level the unit is small enough to be recognisable, which is exactly why its edges are drawn so carefully.
Photo: California 2024 presidential election by census block group · Wikimedia CommonsThe smallest unit, and the reason it exists
A census block is the smallest geographic unit for which a national statistical office will publish data. In the United States, the Census Bureau draws them from the visible fabric of the urban landscape — streets, walls, waterways, property lines — so that every address falls inside exactly one. In the United Kingdom, the equivalent unit is the output area, constructed to similar logic: small enough to protect individual privacy through aggregation, large enough that the published count is statistically meaningful.
That tension — between resolution and disclosure — is what produces the block in the first place. Release data at the household level and you identify people. Release it only at the district level and you lose the granularity that planners, transport modellers and epidemiologists actually need. The block is the negotiated answer: fine enough to be useful, coarse enough to be anonymous.

Compilation is desk work. What a field party recorded is turned into lines by someone who was not there.
Photo: Ron Lach / PexelsThe geometry follows from that constraint, not from any natural feature of the ground. A census tract is drawn around a target population, and the block is a further subdivision of that tract, itself drawn around a smaller number — typically a few dozen to a few hundred residents in the American system, roughly 100 to 625 households in the UK output area standard. Where population is dense, blocks are small in area; in rural areas the same unit swells to cover square miles while still containing roughly the same headcount. Shape a block on a map and you are reading a proxy for density before you look at any attribute table.
The boundaries that define a block are almost always borrowed from existing surveys. Street centrelines come from road network datasets; waterways from hydrographic records; administrative edges from higher-tier boundaries that were themselves inherited from earlier purposes. This layering means that when any contributing feature is revised — a road realigned, a river recharted — the block boundary may shift without any explicit decision about the block itself. The block is downstream of everything.
That dependency matters for anyone comparing data across census cycles. Two blocks nominally covering the same neighbourhood may have different extents if the street network was updated between counts. Tabulating change over time without checking whether the geometry changed is a common error. Many offices publish a correspondence file alongside each new block layer, mapping old units to new ones — it is worth reading before assuming continuity.

A sphere cannot be flattened without tearing or stretching it. Every projection decides which property survives the transfer.
The block level is published because it is the finest grain at which a statistical agency is willing to commit. Below it, the agency knows the ground. It chooses not to show you.
- Census block (US)a few dozen to a few hundred residents; bounded by streets, waterways, property lines
- Output area (UK)100–625 households; shaped to homogeneity of population as well as size
- Target populationthe headcount a block is designed to aggregate to; drives its geographic size